Solutions at the
Speed of Relevance
scroll to discover
Solutions
Complete datasets of wireless networks, cellular infrastructure, and associated devices easily accessible through REST API or CSV delivery
Interactive visualization of the information environment that combines clarity, context, and relevance.
Mission ready and project based teams designed to survey and analyze an array of environments, domains, and dimensions.
Insights
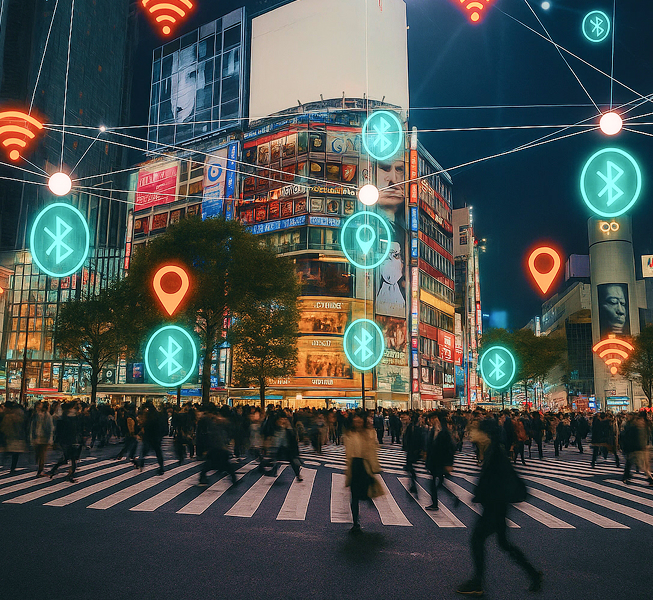
Bangkok’s wireless network is extensive and multi-layered. City cores (e.g. central markets, transit hubs) enjoy thousands of overlapping Wi‑Fi access points and abundant Bluetooth/BLE beacons, supporting robust connectivity and Smart City applications. Most networks use modern WPA2 encryption (typically >80–90%), with only a small fraction of open or obsolete (WEP) links remaining. However, coverage and security are uneven: peripheral and lower-income districts show sparse networks and occasional unsecured hotspots.
A survey of 112,312 Wi‑Fi, Bluetooth and cellular detections pinpoints an industry that has colonized the city in four distinct formations. Two mega‑hubs dominate the map. One occupies a single downtown hotel‑casino block and radiates ~1,827 unique devices (density 10x higher than any neighboring block). Another spreads across the coastline with ~1.3 thousand devices, half of them concealed behind ~244 hidden SSIDs. North‑east of the city a third formation of 600-800 devices clustered among warehouse‑style buildings within the special‑economic zone.
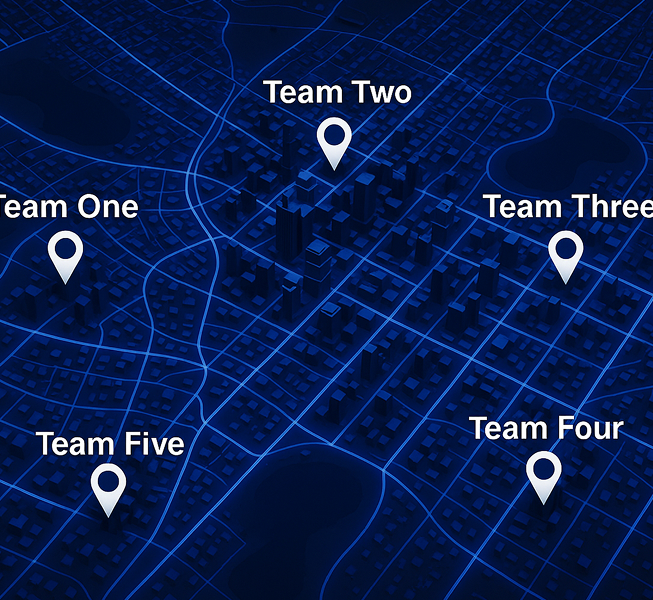
Survey teams conducted detailed wireless surveys covering an area extending three to five kilometers around the target location capturing comprehensive data on Wi-Fi, Bluetooth Classic, Bluetooth Low Energy (BLE), and cellular signals. The surveys established a clear baseline of normal wireless activity that includes device counts, vendor presence, expected signal strengths, and common transmission patterns.


